

Fixing Core Web Vitals on one page is a checklist problem. Fixing them across a site with hundreds of templates, dozens of contributors, and a codebase nobody fully remembers writing is an engineering problem. Most Core Web Vitals guides are written for the first case. This one is written for the second.
Core Web Vitals engineering is the practice of treating Largest Contentful Paint (LCP), Interaction to Next Paint (INP), and Cumulative Layout Shift (CLS) as systems to be diagnosed, prioritized, and monitored at the template level – not as a one-time website audit you run before a launch. Globally, only about 48% of mobile web origins and 56% of desktop origins currently pass all three metrics, according to the HTTP Archive’s 2025 Web Almanac. That means more than half the mobile web is still failing a standard Google has treated as a ranking signal since 2021. This guide is a practical framework for closing that gap on real, multi-template, multi-team websites.
What Are Core Web Vitals? A Quick Definition
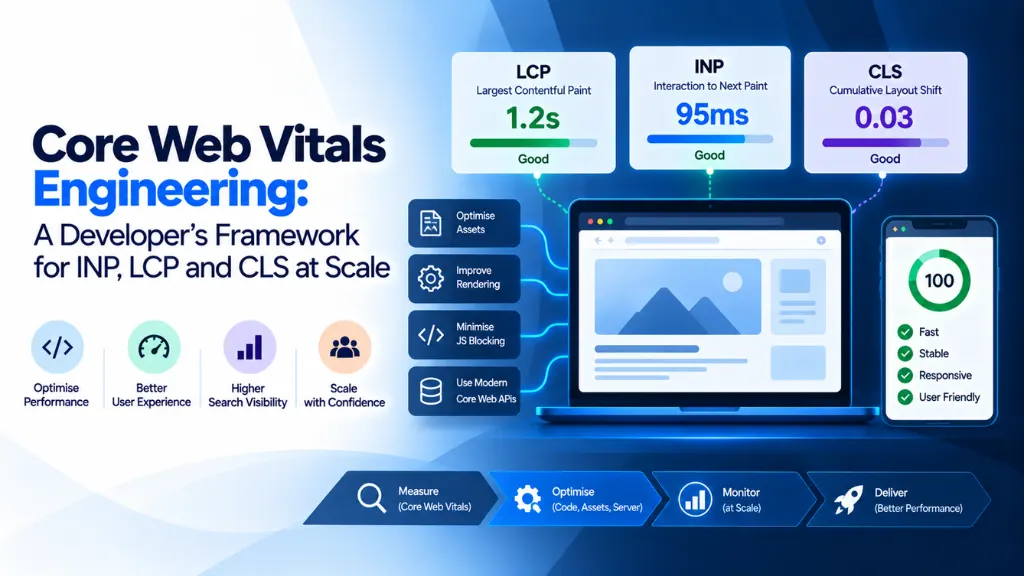
Core Web Vitals are three field metrics Google uses to measure real-world page experience: LCP (loading speed), INP (responsiveness), and CLS (visual stability). Google evaluates each at the 75th percentile of real Chrome users – meaning 75% of visits to a page must meet the “good” threshold for that page to pass.
| Metric | Measures | Good threshold | Poor threshold |
| LCP (Largest Contentful Paint) | Time until the largest visible element renders | Under 2.5 seconds | Over 4 seconds |
| INP (Interaction to Next Paint) | Responsiveness across all user interactions | Under 200 milliseconds | Over 500 milliseconds |
| CLS (Cumulative Layout Shift) | Unexpected visual movement during load and interaction | Under 0.1 | Over 0.25 |
INP replaced First Input Delay (FID) as the official responsiveness metric on March 12, 2024. The distinction matters for engineering priorities: FID only measured the delay before the browser could begin handling the first interaction on a page. INP measures the full round-trip – input delay, processing time, and rendering – across every interaction during a visit, which is why it has proven harder to pass than FID ever was.
Why Core Web Vitals Engineering Is Different From a Page-Level Audit
A single-page audit answers “why is this page slow?” A Core Web Vitals engineering framework answers “why do these 40 templates fail, and which fix moves the most traffic?” The difference matters because most sites don’t have one performance problem – they have several, distributed unevenly across page types.
The workflow that works at scale looks like this:
- Segment by template, not by URL. A product page, a blog post, and a category page fail for different reasons. Auditing them as one undifferentiated pool wastes engineering time on fixes that only apply to a fraction of your traffic.
- Diagnose with field data first, lab data second. Google ranks on real-user CrUX data, not Lighthouse scores. A page can score 100 in a lab test and still fail in the field if real users are on slower networks or devices than your test environment assumes.
- Fix in dependency order. Time to First Byte (TTFB) affects LCP; LCP fixes are wasted if server response time is the real bottleneck. Work through the delivery chain before optimizing individual assets.
- Prioritize by traffic × failure severity, not by which metric is easiest to fix. A template with moderate CLS issues but massive traffic often outranks a rarely visited page with a severe LCP problem.
- Re-verify against the same p75 model Google uses, not an average or median, since a handful of fast sessions can mask a real problem for most users.
Engineering LCP: Loading Performance at Scale
What causes LCP failures? In most cases, one of four things: slow server response time, render-blocking CSS or JavaScript, an unoptimized or late-discovered hero image, or client-side rendering that delays the largest element until after JavaScript executes.
The highest-leverage fixes, in the order most teams should tackle them:
- Reduce TTFB first. No LCP optimization outperforms a server that takes 2 seconds to respond before rendering even starts. Caching, a CDN, and reducing backend query time belong ahead of frontend work.
- Make the LCP resource discoverable in the initial HTML. If your hero image is injected by JavaScript after the initial page load, the browser can’t start fetching it early. Use standard <img> tags with fetchpriority=”high” rather than background images set via CSS or JS.
- Compress and correctly size images. Serving a 2MB hero image at display dimensions of 800px wide is one of the most common and easiest-to-fix causes of LCP failure across template-driven sites.
- Eliminate render-blocking resources above the fold, deferring non-critical CSS and JavaScript.
At Google’s documented scale, Vodafone Italy ran an A/B test isolating LCP as the only variable between two otherwise identical landing pages. The page with a 31% better LCP score generated 8% more sales, a 15% better lead-to-visit rate, and an 11% better cart-to-visit rate – with no visual or content differences between the two versions. Indian beauty retailer Nykaa saw a 28% increase in organic traffic from Tier 2 and Tier 3 cities after a 40% LCP improvement driven by image compression, WebP conversion, and deferred non-critical JavaScript, according to Google’s published case study.
Engineering INP: The Hardest Metric to Fix at Scale
Why is INP the hardest Core Web Vital to pass? Because it requires structural JavaScript changes, not asset optimization. You can’t compress your way to a good INP score – you have to change how your code handles the browser’s main thread during user interactions.
INP fails when the main thread is busy running JavaScript at the exact moment a user taps, clicks, or types, delaying the browser’s ability to paint a visual response. The engineering fixes:
- Break up long tasks. Any JavaScript task running longer than 50ms blocks the main thread from responding to input. Splitting large functions into smaller chunks using setTimeout, requestIdleCallback, or the scheduler.yield() API lets the browser interleave user input handling between chunks.
- Defer non-critical JavaScript, especially third-party scripts (analytics, chat widgets, ad tags) that execute on load but aren’t needed for the first interaction.
- Audit event handlers, particularly on scroll, input, and click events, for expensive DOM operations, layout thrashing, or unnecessary re-renders.
- Reduce hydration cost on JavaScript-framework sites. Frameworks that hydrate large component trees on load – rather than progressively or selectively – tend to score worse on INP because the main thread is occupied precisely when early interactions happen.
Google Chrome engineering leader Addy Osmani, who has led developer experience work across Lighthouse and Core Web Vitals, has summarized the core INP problem simply: JavaScript is “your most expensive asset” – not because of download size alone, but because of what the browser has to process before it can respond to a user. That framing is useful for engineering teams deciding where to spend optimization time: INP problems are rarely fixed by a CDN or a caching plugin. They require someone reading a JavaScript execution trace.
Engineering CLS: Visual Stability Across Templates
What causes layout shift? Images or ads without reserved dimensions, web fonts that swap in and reflow text, content injected above existing content, and animations that use layout-triggering CSS properties instead of transform.
The systematic fixes:
- Always set explicit width and height (or aspect-ratio) on images, video embeds, and ad slots so the browser reserves space before the asset loads.
- Use font-display: optional or preload critical fonts to avoid the “flash of unstyled text” that reflows the page when a webfont finally loads.
- Never insert content above existing content unless it’s in direct response to a user interaction – a common CLS failure on sites that inject cookie banners, promotional bars, or late-loading widgets above the main content area.
- Animate with transform and opacity instead of properties like top, left, width, or height, which trigger layout recalculation.
Cosmetics brand iCook improved ad revenue by 10% after reducing CLS by 15%, achieved by pre-allocating fixed ad slot sizes and adjusting header-bidding script priority, according to Google’s own case study repository – evidence that visual stability isn’t just a ranking checkbox, it directly affects how long users stay engaged with a page.
What CMS and Platform Choice Actually Changes
Platform architecture shapes which metric fails, not whether your site passes or fails overall. WordPress is a useful example: field data from HTTP Archive’s November 2025 CrUX snapshot shows WordPress sites scoring strongly on INP (roughly 86% good) but weakly on LCP, with mobile Core Web Vitals pass rates around 46%. In other words, WordPress’s Core Web Vitals problem is almost entirely a loading problem, not a responsiveness one – which changes where engineering time should go for teams on that platform. A team that spends a sprint on JavaScript main-thread optimization when their actual bottleneck is unoptimized hero images and slow TTFB will see no movement in their pass rate.
This is the core argument for template-level diagnosis over generic “Core Web Vitals checklists”: the same three-letter metric names mask very different underlying problems depending on your stack, your hosting, and how your team built the site – which is exactly what a proper technical SEO services engagement is built to diagnose before a single line of code changes.
A Practical Workflow for Fixing Core Web Vitals at Scale
- Pull Search Console’s Core Web Vitals report to identify which templates or URL groups are failing, and on which metric.
- Cross-reference against CrUX field data (via PageSpeed Insights or the CrUX API) to confirm the failure is real-world, not a lab artifact.
- Fix TTFB and server response time before touching frontend code.
- Address LCP through image optimization, resource prioritization, and render-blocking cleanup.
- Address INP through JavaScript task-splitting and third-party script auditing.
- Address CLS through reserved dimensions and font-loading strategy.
- Re-measure against p75 field data, not an average, and monitor continuously rather than treating the fix as a one-time project.
Skipping the order matters. Teams that jump straight to JavaScript optimization on a site whose real bottleneck is server response time spend weeks chasing an improvement that never shows up in the field data, because the underlying constraint was never touched.
Common Mistakes in Core Web Vitals Engineering
- Optimizing for Lighthouse instead of CrUX. Lab scores use a fixed simulated environment; field data reflects your actual users’ devices and networks, which is what Google ranks on.
- Treating all pages as one dataset. Site-wide averages hide the specific templates dragging your pass rate down.
- Fixing the easiest metric instead of the highest-impact one. CLS is often the fastest to fix but frequently isn’t the reason a high-traffic template is failing.
- Declaring victory after one fix. Core Web Vitals are a moving target – new content, new third-party scripts, and new features can regress a passing page within weeks, and a site that has already lost rankings from a regression may need search engine recovery services rather than a routine fix.
Why This Also Matters for AI Search
Search Savvy’s technical audits consistently show that the same engineering discipline behind good Core Web Vitals – clean server-rendered HTML, fast delivery, and stable layouts – also supports how well AI answer engines like Google AI Overviews, ChatGPT, and Perplexity can crawl and extract content, a discipline covered directly under AI search optimization (AEO/GEO) services. A page that loads slowly or shifts content around is harder for both users and machines to parse reliably. Search Savvy generally treats Core Web Vitals work as foundational technical SEO rather than a separate initiative, since a site failing field performance thresholds is competing at a structural disadvantage regardless of content quality.
Frequently Asked Questions
What is a good Core Web Vitals score? A page passes when at least 75% of real visits record “good” scores on all three metrics: LCP under 2.5 seconds, INP under 200 milliseconds, and CLS under 0.1, based on Google’s Chrome UX Report field data.
Why did INP replace FID as a Core Web Vital? FID only measured delay before the first interaction was processed. INP measures full responsiveness – input delay, processing time, and rendering – across every interaction during a visit, giving a more complete picture of how a page actually feels to use.
Is INP harder to fix than LCP? Generally, yes. LCP problems are often solved with image optimization, caching, and resource prioritization. INP problems require restructuring how JavaScript executes on the main thread, which is a deeper engineering change than most asset-level fixes.
Do Core Web Vitals directly affect Google rankings? They’re one of many ranking signals, primarily acting as a tiebreaker between pages of similar relevance and authority. They rarely override strong content and backlinks on their own, but in competitive search results they can be the deciding factor.
How often should Core Web Vitals be monitored? Continuously, not just before launch. New content, third-party scripts, and feature releases can regress a previously passing template within weeks, so ongoing field-data monitoring through Search Console or a RUM tool is necessary to catch regressions early.
Can a fast-loading site still fail Core Web Vitals? Yes. A page can load quickly (good LCP) while still failing on responsiveness (INP) or visual stability (CLS). All three metrics must independently meet their thresholds at the 75th percentile for a page to pass overall.
The Bottom Line
Core Web Vitals engineering at scale isn’t about chasing a green score on one page – it’s about building a repeatable process that diagnoses the right metric, on the right template, in the right order. Teams that treat LCP, INP, and CLS as one undifferentiated “performance problem” waste engineering cycles on fixes that don’t move their actual pass rate. Start with field data, segment by template, fix the delivery chain before the JavaScript, and monitor continuously rather than once. If your team is unsure where your real bottleneck sits, a template-level audit against CrUX field data – the same approach Search Savvy applies before recommending any performance work – is a faster path to a fix than another generic checklist.