
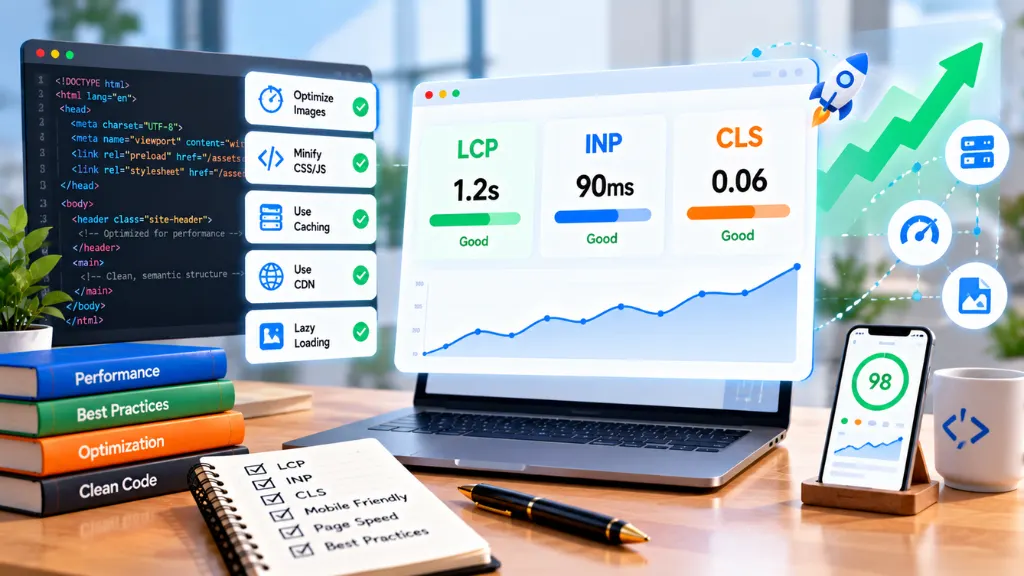

A Core Web Vitals developer checklist comes down to three jobs: measure real-user data first, fix the metric that is actually failing, and prevent regressions in your release process. The targets are Largest Contentful Paint (LCP) of 2.5 seconds or less, Interaction to Next Paint (INP) of 200 milliseconds or less, and Cumulative Layout Shift (CLS) of 0.1 or less, each assessed at the 75th percentile of real visits.
This checklist is organized for implementation: how to measure, then code-level fixes for LCP optimization, render-blocking resources, CLS reduction, and INP, followed by a regression-prevention routine.
Have the Core Web Vitals Thresholds Changed in 2026?
Short answer: No. The “good” Core Web Vitals thresholds remain LCP 2.5 seconds or less, INP 200 milliseconds or less, and CLS 0.1 or less. Claims that Google tightened them, which circulate widely, are not supported by web.dev’s documentation.
| Metric | Good | Needs improvement | Poor |
| LCP | 2.5 s or less | 2.5 to 4.0 s | Over 4.0 s |
| INP | 200 ms or less | 200 to 500 ms | Over 500 ms |
| CLS | 0.1 or less | 0.1 to 0.25 | Over 0.25 |
INP replaced First Input Delay in March 2024, so FID no longer belongs in any checklist. The thresholds are the same on mobile and desktop, but the two are reported separately, and mobile is usually harder to pass.
On ranking, Google’s Search documentation says that a good page experience “aligns with what our core ranking systems seek to reward.” Treat that as a reason to fix real problems, not as a promise that a green score will lift rankings.
Step 1: Measure Field Data Before Touching Code
Short answer: Start with field data from real users, then use lab tools to find causes. A page can score 100 in Lighthouse and still fail in the field, because lab tests use one device and one network.
| Tool | Data type | Use it for |
| Search Console Core Web Vitals report | Field (CrUX) | Finding groups of failing URLs, split by mobile and desktop |
| PageSpeed Insights | Field plus lab | Checking a URL’s real-user data alongside Lighthouse diagnostics |
| Chrome DevTools Performance panel | Lab | Tracing long tasks, layout shifts, and the LCP element |
| Lighthouse | Lab | Debugging and CI checks, not pass or fail verdicts |
| web-vitals JavaScript library | Field (your users) | Capturing attribution data in your own analytics |
Field data in CrUX covers a rolling 28-day window, so expect a delay before fixes show up in Search Console.
Collect your own real-user data
The open-source web-vitals library has an attribution build that tells you which element or interaction caused a poor value:
import { onLCP, onINP, onCLS } from ‘web-vitals/attribution’;
function report({ name, value, id, attribution }) {
const target =
attribution.target ||
attribution.interactionTarget ||
attribution.largestShiftTarget;
navigator.sendBeacon(‘/vitals’, JSON.stringify({ name, value, id, target }));
}
onLCP(report);
onINP(report);
onCLS(report);
Send the results to your analytics endpoint and segment by page template, device, and connection. This shows which template to fix first.
LCP Optimization Checklist
Short answer: Find the LCP element, then shorten each phase before it paints: server response, resource discovery, resource download, and render delay. Most failures come from a late-discovered or oversized hero image.
web.dev’s LCP optimization guide breaks LCP into four sub-parts: time to first byte, resource load delay, resource load duration, and element render delay. Check where the time goes in PageSpeed Insights before choosing a fix.
- Make the LCP image discoverable in the HTML. Do not inject it with JavaScript or hide it in a CSS background.
- Prioritize it. Add fetchpriority=”high” to the LCP <img>.
- Never lazy-load it. loading=”lazy” on above-the-fold images delays the fetch.
- Preload when discovery is late, such as CSS background images or fonts.
- Serve the right size and format. Use srcset, sizes, and modern formats like AVIF or WebP.
- Reduce server time. Use caching, a CDN, and efficient database queries. Slow hosting can defeat every front-end fix.
<link rel=”preload” as=”image” href=”/img/hero-1200.avif”
imagesrcset=”/img/hero-600.avif 600w, /img/hero-1200.avif 1200w”
imagesizes=”100vw” fetchpriority=”high”>
<img src=”/img/hero-1200.avif”
srcset=”/img/hero-600.avif 600w, /img/hero-1200.avif 1200w”
sizes=”100vw” width=”1200″ height=”600″
fetchpriority=”high” alt=”Product hero”>
How Do You Fix Render-Blocking Resources?
Short answer: Render-blocking resources are CSS and synchronous JavaScript the browser must process before it can paint. Inline the CSS needed for the first view, defer the rest, and load scripts with defer or async.
Checklist:
- Audit blockers. Lighthouse and PageSpeed Insights list render-blocking requests.
- Inline critical CSS for above-the-fold content, and load the remainder without blocking.
- Use defer for scripts that need the DOM, and async for independent scripts.
- Remove unused CSS and JavaScript. Tree-shake bundles and delete abandoned libraries.
- Split bundles by route, so a page loads only the code it needs.
- Preconnect to critical third-party origins, such as font or CDN hosts.
- Load third-party tags late. Chat widgets, tag managers, and ad scripts are frequent causes of slow LCP and INP.
<link rel=”preconnect” href=”https://fonts.gstatic.com” crossorigin>
<script src=”/js/app.js” defer></script>
<script src=”https://example.com/widget.js” async></script>
If your theme or CMS adds blocking assets you cannot control, Search Savvy’s technical SEO review can help trace which templates and plugins are responsible.
CLS Reduction Checklist
Short answer: Reserve space for everything that loads late. Layout shift happens when images, ads, embeds, banners, or fonts change size after content is already visible.
- Set width and height (or CSS aspect-ratio) on images, video, and iframes.
- Reserve slots for ads, embeds, and consent banners with fixed or minimum heights.
- Insert new content below the fold, or in response to user input. Shifts shortly after a user interaction are generally not counted.
- Animate with transform and opacity, not properties that trigger layout, such as top, height, or margin.
- Stabilize fonts. Use font-display: swap or optional, preload critical fonts, and use metric-matched fallbacks.
img, video { max-width: 100%; height: auto; }
.hero-img { aspect-ratio: 2 / 1; }
.ad-slot { min-height: 250px; }
@font-face{
font-family: “BrandFont”;
src: url(“/fonts/brand.woff2”) format(“woff2”);
font-display: swap;
}
Use the DevTools Performance panel’s layout shift markers, or the attribution data from the web-vitals library, to find the elements responsible.
INP Checklist: Keep Interactions Under 200 ms
Short answer: INP measures how long the page takes to respond visually after taps, clicks, and key presses across the whole visit. Poor INP is nearly always main-thread work: long JavaScript tasks, heavy event handlers, and expensive rendering.
INP has three phases: input delay, processing time, and presentation delay. Fix the one that dominates in your traces.
- Break up long tasks. Any task over 50 ms blocks the main thread. Yield between chunks.
- Keep handlers light. Do the minimum before the next paint, then defer analytics and non-urgent work.
- Avoid forced reflows. Do not read layout values right after writing styles in a loop.
- Limit DOM size and rendering cost. Virtualize long lists and use content-visibility: auto for off-screen sections.
- Audit third-party scripts, which often add input delay.
- Move heavy computation to a Web Worker where practical.
function yieldToMain() {
if (‘scheduler’ in window && ‘yield’ in scheduler) {
return scheduler.yield();
}
return new Promise(resolve => setTimeout(resolve, 0));
}
async function processItems(items) {
for (const item of items) {
handle(item);
await yieldToMain();
}
}
The scheduler.yield() API is not available in every browser, so the fallback matters. For diagnosis, the Long Animation Frames (LoAF) data and the DevTools Performance panel point to the scripts behind slow interactions.
Which Fix for Which Symptom?
| Symptom | Likely cause | First fix |
| LCP over 4 s on mobile | Late or oversized hero image, slow server | Prioritize and resize the image; improve TTFB |
| Long gap before LCP resource starts | Image found late (JS-injected or CSS background) | Put it in HTML; preload |
| CLS spikes on article pages | Images without dimensions, late embeds | Add dimensions; reserve space |
| Text jumps when fonts load | Font swap without matching fallback | Preload; use metric-matched fallback |
| INP fails on menus or filters | Heavy click handlers | Yield; defer non-urgent work |
| Good lab score, bad field score | Real devices and third-party tags | Use RUM data and test on a mid-range phone |
How Do You Prevent Regressions?
- Set performance budgets for JavaScript size, image weight, and key timings.
- Run Lighthouse in CI on key templates as a guardrail, not as the final verdict.
- Monitor field data weekly from Search Console and your own RUM.
- Review new third-party scripts before adding them.
- Test on a throttled mid-range device before major releases.
- Document the LCP element and layout slots for each template, so new features do not break them.
For a site-wide review, Search Savvy’s website audit looks at performance alongside crawl and indexing health, and its website design and development services cover performance-minded builds. The website design and development glossary defines related terms.
Common Core Web Vitals Mistakes
- Optimizing the Lighthouse score instead of field data.
- Lazy-loading the hero image.
- Judging results too early. CrUX uses a 28-day window.
- Fixing only one page when the problem lives in a shared template.
- Adding third-party tags without testing their effect.
- Ignoring hosting and TTFB.
- Animating layout properties.
Frequently Asked Questions
What are the Core Web Vitals in 2026?
LCP, INP, and CLS. They measure loading, responsiveness, and visual stability, and the good thresholds are 2.5 seconds, 200 milliseconds, and 0.1 respectively.
How do I check Core Web Vitals?
Use Search Console for site-wide field data, PageSpeed Insights for a URL’s real-user and lab data, and the web-vitals library for your own users.
Why is my Lighthouse score good but Search Console shows failures?
Lighthouse is a lab test on one simulated device. Search Console uses real-user data from the Chrome User Experience Report, which reflects actual devices, networks, and behavior.
How long until fixes show in Search Console?
Field data covers a rolling 28-day window, so full improvement can take several weeks to appear.
Do render-blocking resources always hurt LCP?
They delay first paint, which can delay LCP. Inline critical CSS, defer scripts, and remove unused code to reduce the effect.
Are Core Web Vitals a ranking factor?
Google says its ranking systems reward good page experience, but content relevance still matters more. Fix vitals for users first.
The Practical Takeaway
Measure field data, identify the failing metric and template, fix the root cause in code, and guard against regressions with budgets and monitoring. Do that, and the thresholds stop being a mystery and become a maintenance task.
If you want help working through a stubborn performance problem, Search Savvy can support the diagnosis alongside a broader technical review.