What Is Page Speed and How Does It Impact SEO Rankings?
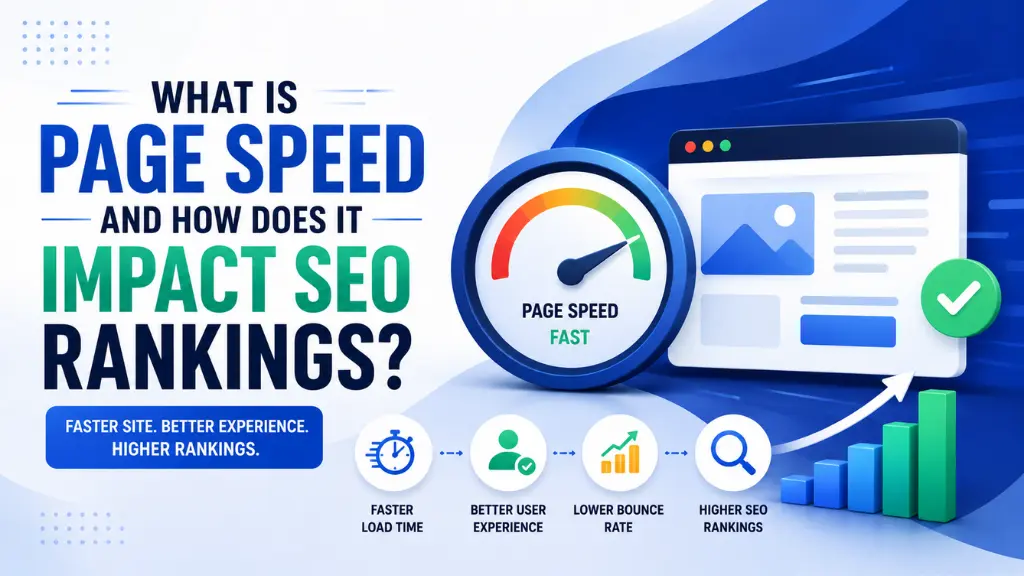

Here is a number that should concentrate the mind before anything else about this topic: a one-second delay in page load time reduces conversions by 7%. On a website generating ₹10 lakh per month in revenue, a single second of unnecessary delay costs roughly ₹8.4 lakh in lost annual revenue – from one performance problem that is entirely fixable.
In this article16 sections
Page speed is how quickly a webpage loads and becomes fully interactive for a user. It has been a Google ranking factor in some form since 2010, but its role in search performance has changed significantly in the years since – evolving from a simple “fast or slow” binary into a precise, multi-dimensional measurement framework that uses real user data from actual Chrome browsers.
Page speed in 2026 is measured through Google’s Core Web Vitals – three specific metrics that reflect how a page actually feels to load for real users, not just how quickly the server technically responds. As of May 2026 CrUX field data, only 55.9% of all tracked web origins pass all three thresholds. That means roughly 44% of websites are operating below the benchmarks that directly influence search rankings.
Page speed also affects visibility across AI search surfaces in 2026. AI Overviews, which appear on over 55% of Google search results globally, are generated by systems that evaluate the same page quality signals Google uses for traditional rankings. A slow page is a lower-quality page by Google’s own measurement standards – and that quality assessment applies to AI citation eligibility as much as traditional SERP position.
At Search Savvy, page speed is the first technical diagnostic we run on any new client site, because performance problems are upstream of everything else. A fast website cannot guarantee rankings, but a slow one creates a ceiling that limits how effective every other SEO investment can be.
What Is Page Speed and How Is It Measured?#
Page speed is a composite measurement of how quickly a webpage loads, renders, and becomes interactive for the user – covering not just the raw time until the first byte of data arrives but the full experience of how content appears and how the page responds to user input.
Page speed measurement has two modes: lab data and field data.
Lab data is generated by automated tools running a page in a simulated environment. Lighthouse, built into Chrome DevTools and available through Google PageSpeed Insights, generates lab scores by loading pages in a controlled environment and measuring specific performance metrics. Lab scores are useful for diagnosing specific issues and testing changes before release.
Field data is collected by Chrome from real users on real devices over a rolling 28-day window through the Chrome User Experience Report (CrUX). This is what Google uses for ranking signals – not the lab score. A perfect Lighthouse score in developer tools does not guarantee a passing field data assessment, because real users access sites from mid-range mobile devices on variable network connections that no lab simulation fully replicates.
People Also Ask: Is Google PageSpeed Insights score the same as what Google uses for rankings? Short Answer: No. PageSpeed Insights shows two things: Lighthouse lab data (the score out of 100) and CrUX field data (real user measurements from Chrome). Google uses the CrUX field data for ranking signals through Core Web Vitals – not the Lighthouse lab score. A page with a 95 Lighthouse score but poor real- world field data can still fail Core Web Vitals from Google’s ranking perspective.
What Are Google’s Core Web Vitals and How Do They Relate to Page Speed?#
Page speed in Google’s current framework is measured through three Core Web Vitals metrics, each capturing a different dimension of the user experience a page delivers.
LCP (Largest Contentful Paint) – Loading Performance#
Page speed as measured by LCP captures how long it takes for the main visible content element – typically a hero image, video thumbnail, or large text block above the fold – to become visible to the user.
The 2026 threshold: LCP under 2.5 seconds is “Good.” Between 2.5 and 4.0 seconds is “Needs Improvement.” Above 4.0 seconds is “Poor.”
As of May 2026 CrUX data, 68.6% of all tracked web origins achieve “Good” LCP – meaning 31.4% are still failing on this metric alone.
INP (Interaction to Next Paint) – Responsiveness#
Page speed as measured by INP captures how quickly a page responds visually to user interactions – clicks, taps, and key presses – throughout the full page visit, not just on initial load. This metric replaced First Input Delay (FID) in March 2024 and is significantly stricter.
The 2026 threshold: INP under 200 milliseconds is “Good.” Between 200 and 500ms is “Needs Improvement.” Above 500ms is “Poor.”
INP is the hardest metric to fix because its failures are caused by JavaScript architecture problems – main thread blocking – rather than simple asset size issues.
CLS (Cumulative Layout Shift) – Visual Stability#
Page speed as measured by CLS captures how much the page content unexpectedly moves while loading – images jumping into position, content shifting as fonts load, and elements displacing each other as ads or embeds render after the initial HTML.
The 2026 threshold: CLS under 0.1 is “Good.” Between 0.1 and 0.25 is “Needs Improvement.” Above 0.25 is “Poor.”
CLS is the most widely passed metric, with 81.3% of origins achieving “Good” status in May 2026 data – but failures cause some of the most frustrating user experiences, particularly on mobile where shifted content causes users to tap the wrong element.
People Also Ask: Do all three Core Web Vitals need to pass for page speed to help SEO rankings? Short Answer: Yes. A site passes Core Web Vitals overall only when all three metrics – LCP, INP, and CLS – simultaneously achieve “Good” status at the 75th percentile of real Chrome user sessions. One failing metric means the page fails the overall assessment, regardless of how well the other two perform. As of May 2026, only 55.9% of tracked origins pass all three simultaneously.
Why Is Page Speed Important for SEO Rankings in 2026?#
Page speed affects SEO rankings in 2026 through two distinct mechanisms that work simultaneously.
The first is its status as a confirmed Google ranking signal through Core Web Vitals. Google incorporated LCP, FID (now replaced by INP), and CLS into its ranking algorithm as part of the Page Experience update in 2021, and the weight of these signals was specifically strengthened in the March 2026 Core Update. Pages with strong Core Web Vitals have a measurable advantage over equivalent content with poor performance scores in competitive SERP positions.
The second mechanism is user behaviour. Page speed affects how long users stay on a page, whether they convert, and whether they return – and these engagement signals feed into Google’s ranking systems through NavBoost and similar mechanisms. The connection between speed, engagement, and rankings is direct and measurable:
- Bounce rate increases by 32% as load time rises from 1 to 3 seconds
- Bounce rate increases by 106% as load time rises from 1 to 6 seconds
- Pages loading in under 1 second convert at 3x the rate of pages loading in 5 seconds
- A one-second delay in page response reduces conversions by 7%
- 53% of mobile users abandon a site that takes more than 3 seconds to load
Page speed also affects AI search eligibility in 2026. Google’s AI Overviews are generated from the same index and use the same quality signals as traditional rankings. A slow page that fails Core Web Vitals is a lower-quality page by Google’s own standards, making it less likely to earn AI Overview citations than an equivalent faster competitor.
What Are the Most Common Causes of Slow Page Speed?#
Page speed failures in 2026 trace back to a consistent set of root causes. Understanding which category applies to a specific page determines which fix to apply.
Unoptimised Images#
Page speed is most commonly degraded by oversized, uncompressed images served in outdated formats. A hero image served as a 2MB JPEG instead of a compressed WebP file at 300KB delays LCP on mobile connections by seconds. Image optimisation is the single highest-ROI page speed fix for most websites because it is technically straightforward and produces immediate, measurable LCP improvement.
Render-Blocking Resources#
Page speed is blocked when JavaScript and CSS files in the document head must fully download and execute before the browser can begin rendering visible content. Third-party scripts from analytics platforms, chat widgets, ad networks, and marketing tag managers are the most frequent offenders.
The fix is to add defer or async attributes to non-critical JavaScript, inline critical CSS directly in the HTML head, and remove or defer any third-party script that does not need to execute before the page first renders.
Heavy JavaScript Causing INP Failures#
Page speed responsiveness specifically fails when JavaScript tasks running on the browser’s main thread take longer than 50 milliseconds, blocking the browser from responding to user input. This produces INP failures – the page appears loaded but does not react immediately to clicks or taps.
The fix requires breaking long JavaScript tasks into smaller chunks using requestIdleCallback() or the newer scheduler.yield() API, and auditing third-party scripts for unnecessary main-thread blocking.
Images Without Defined Dimensions (CLS Failures)#
Page speed visual stability fails when the browser cannot reserve space for elements before they load. An image without explicit width and height attributes causes the browser to adjust the layout when the image arrives, shifting all surrounding content downward.
The one-line fix: add width and height attributes to every <img> tag in the HTML.
Slow Time to First Byte (TTFB)#
Page speed improvement on the server side targets TTFB – the time between a browser sending a request and receiving the first byte of data from the server. Google’s guidance targets TTFB under 800ms. Slow TTFB is caused by slow server hardware, high geographical distance between server and user, or resource- intensive database queries running before any content can be delivered.
The primary fix is using a Content Delivery Network (CDN) to serve content from geographically closer server nodes, reducing the physical distance data travels.
People Also Ask: What is the fastest page speed fix to improve Google rankings? Short Answer: Converting hero and large images from JPEG or PNG to WebP format is typically the fastest, highest-impact fix for improving LCP – the Core Web Vitals metric most commonly causing failures. WebP files are 25 to 35% smaller than equivalent JPEG or PNG files with no visible quality difference. Combined with adding explicit image dimensions (which also resolves CLS simultaneously), this single set of changes frequently moves two metrics from “Needs Improvement” to “Good.”
How Do You Measure and Monitor Page Speed?#
Page speed monitoring in 2026 requires using field data rather than relying exclusively on lab scores. Three tools cover the full measurement picture:
Google Search Console Core Web Vitals Report
Navigate to “Experience” in Google Search Console to access the Core Web Vitals report, which shows pages classified as “Good,” “Needs Improvement,” or “Poor” based on real CrUX field data – separately for mobile and desktop. This is the most accurate view of how Google actually assesses your pages.
Enter any URL to see both Lighthouse lab scores for diagnostic purposes and CrUX field data for the same URL. The lab data identifies specific issues. The field data confirms actual user experience. Both are necessary – neither alone is sufficient.
Chrome DevTools Performance Panel
For diagnosing specific INP failures and long JavaScript tasks, the Performance panel in Chrome DevTools records detailed timelines of exactly what the browser is doing during a page load, identifying which specific scripts are blocking the main thread.
How Does Page Speed Affect Indian Websites Specifically?#
Page speed matters disproportionately for Indian websites because the device and network conditions that actual Indian users access sites on are significantly different from the conditions that a desktop-based Lighthouse test replicates.
India’s internet users skew heavily toward mid-range Android devices on 4G connections – often with network latency considerably higher than fibre broadband. A page that scores 85 on Lighthouse on a desktop testing environment can score below 50 when Lighthouse is set to mobile throttled mode – and the CrUX field data often reflects the mobile-throttled reality rather than the clean desktop benchmark.
According to Search Savvy’s insights from auditing page speed for Indian D2C, e-commerce, and service websites, the three highest-impact fixes for Indian audiences specifically are: converting images to WebP with compressed file sizes, deferring all third-party scripts until after the main content renders, and switching to a CDN with Indian server nodes to reduce TTFB on mobile connections.
At Search Savvy, we test page speed using mobile throttling enabled in PageSpeed Insights for every Indian client site, rather than accepting desktop Lighthouse scores that significantly overestimate actual performance for the majority of the real user base.
Conclusion: Speed Is Both an SEO and a Revenue Signal#
Page speed is not a technical nicety reserved for large enterprise sites. It is a direct ranking signal, a confirmed conversion driver, and an AI search eligibility factor – affecting every category of website on every traffic source, simultaneously.
Search Savvy, the websites we see generating the most consistent organic growth in 2026 are not necessarily the ones with the most content or the most backlinks – they are the ones that pass Core Web Vitals consistently across mobile and desktop, because passing creates a performance floor below which competitors who fail cannot follow.
FAQ: Page Speed and SEO Rankings – Your Questions Answered#
Q1: Is page speed a direct Google ranking factor in 2026? Yes. Page speed is measured through Core Web Vitals – LCP, INP, and CLS – which are confirmed Google ranking signals incorporated through the Page Experience update in 2021. The weight of these signals was strengthened in the March 2026 Core Update. Pages with strong Core Web Vitals have a measurable advantage in competitive SERP positions over equivalent content with poor performance.
Q2: What is the difference between page speed and Core Web Vitals? Page speed is the broad concept of how quickly a webpage loads. Core Web Vitals are Google’s specific measurement framework for page speed – three precise metrics (LCP for loading, INP for responsiveness, CLS for visual stability) that Google uses as actual ranking signals. “Page speed” describes the general phenomenon; Core Web Vitals are how Google measures and ranks it.
Q3: Can I improve page speed without a developer? Partially. Some fixes – enabling browser caching, choosing faster hosting, or compressing images through a CMS plugin – are manageable without developer involvement. INP fixes that require JavaScript architecture changes, server configuration for TTFB optimisation, and resource-level critical CSS inlining typically require developer expertise. Many high-impact page speed improvements fall into the developer-required category.
Q4: Does page speed affect mobile and desktop rankings separately? Yes. Google uses mobile field data as the primary signal under mobile-first indexing, which applies to nearly all modern websites. The Core Web Vitals report in Search Console separately tracks mobile and desktop performance. A site passing Core Web Vitals on desktop but failing on mobile is failing for ranking purposes, since the mobile assessment carries more weight.
Q5: How long does it take for page speed improvements to affect rankings? CrUX field data updates on a 28-day rolling window, so allow at least 28 days after fixing page speed issues before the Search Console Core Web Vitals report reflects improvements. Ranking changes that result from improved Core Web Vitals typically follow the CrUX update by a further one to three weeks as Google re-evaluates page experience signals across the affected pages.
Q6: Does page speed affect AI Overview eligibility in Google? Yes, indirectly. Google’s AI Overviews are generated by systems using the same index and quality signals as traditional rankings. Pages failing Core Web Vitals are lower-quality pages by Google’s own standards, making them less likely to be selected as AI Overview sources than equivalent content on faster, technically healthier pages.
Your PageSpeed Insights score looks good but Search Console is still showing Core Web Vitals failures – or not sure which speed issues are hurting rankings most on mobile? Visit Search Savvy for a technical performance audit that diagnoses your specific CWV failures and prioritises fixes by revenue and ranking impact.