Advanced Core Web Vitals: INP Optimisation Strategies Beyond the Basics
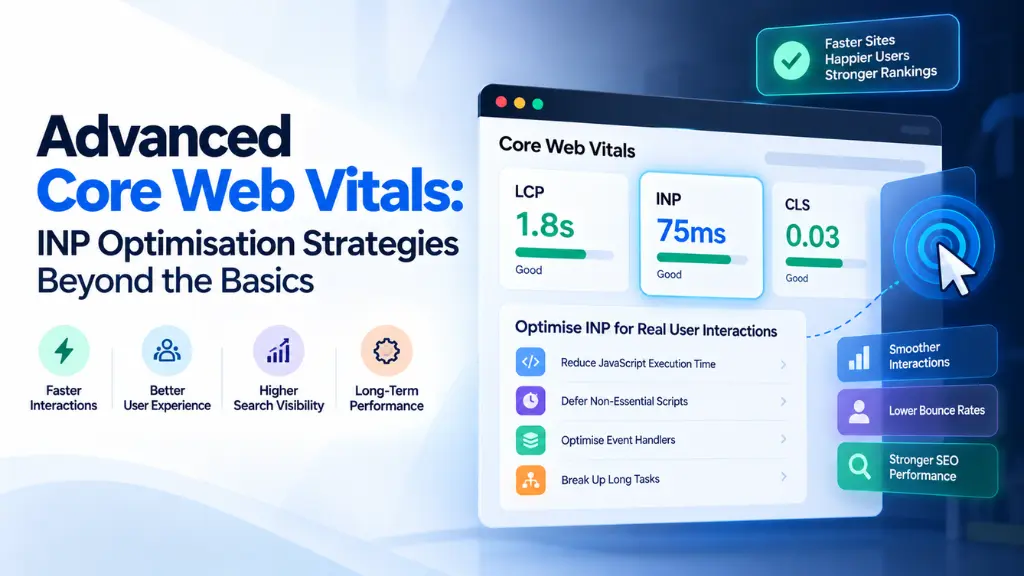

If your team has already broken up long tasks, deferred non-critical scripts, and trimmed third-party bloat, and your Interaction to Next Paint score still isn’t where it needs to be, you’ve run into the ceiling that basic Core Web Vitals advice hits. The standard checklist – split your bundles, defer what you can, lazy-load images – gets most sites into “needs improvement” territory. Getting into consistently “good” territory on a complex, JavaScript-heavy site usually requires diagnosing exactly which phase of an interaction is slow and why, not just applying the same generic fixes harder.
In this article12 sections
There’s a well-documented story about Larry Page reviewing an early version of Gmail that captures why this precision matters. Watching a demo on his own computer, Page reportedly said flatly, “It’s too slow,” even as the engineer showing it to him insisted it was loading fine. Checking the server logs afterward confirmed it: the page had taken exactly 600 milliseconds to load – a delay Page had noticed without any tool telling him so. That instinct for perceptible responsiveness, not just an average load-time number, is precisely what INP is built to measure, and it’s exactly why generic fixes stop working once a site clears the obvious performance wins.
This guide, drawing on the performance diagnostics we run for clients at Search Savvy, picks up where the basics leave off. It assumes you already know INP replaced First Input Delay as a Core Web Vital in March 2024 and that “good” means staying under 200 milliseconds at the 75th percentile of real user sessions. What it covers instead is how to actually find the specific script or rendering pattern causing the slowdown, and the architectural and API-level fixes that move the needle once the obvious wins are gone.
Why Basic INP Fixes Stop Working on Complex Sites#
Generic advice – reduce JavaScript, defer non-critical work, minimize the DOM – is correct as far as it goes, but it treats every slow interaction the same way. In reality, a slow interaction can be slow for genuinely different reasons: the browser might be busy running unrelated code when the user clicks (input delay), your event handler itself might be doing too much work (processing duration), or the browser might be doing expensive layout and paint work after your code finishes (presentation delay). Applying a blanket fix – say, code-splitting everything – helps some of the time but does nothing for the other two phases, which is exactly why teams that “did everything right” on paper still see INP scores stuck in the amber zone.
What’s the Real Difference Between INP and the Old FID Metric?#
FID only measured the delay before the browser could begin processing the very first user interaction on a page – it said nothing about how long that processing took, or about any interaction after the first. INP measures the full lifecycle of every interaction throughout a page’s life and reports a representative worst-case value, which is why sites that looked fine under FID often surfaced real problems once INP became the standard.
Advanced Diagnosis: Understanding the Three Phases of an Interaction#
Every interaction INP measures breaks down into three phases, and advanced optimization starts with figuring out which one is actually the bottleneck rather than guessing.
- Input delay – the time between the user’s action and the browser being free to start handling it. Long input delay usually means something else was already hogging the main thread when the click or tap happened.
- Processing duration – the time your event handlers and any code they trigger actually take to run.
- Presentation delay – the time between your code finishing and the browser actually painting the next frame, often driven by layout recalculation or expensive rendering work.
The Event Timing API is what makes this breakdown measurable in the first place, giving each of the three phases its own duration rather than a single opaque interaction time. Treating these as one undifferentiated number is the single biggest reason basic optimization efforts stall – you can spend weeks reducing JavaScript execution time and see almost no INP improvement if your actual problem is presentation delay caused by layout thrashing.
Diagnosing the Real Culprit: The Long Animation Frames (LoAF) API#
This is the tool that separates advanced INP work from guesswork, and the kind of attribution data we lean on for performance audits at Search Savvy. The Long Animation Frames API, which shipped in Chrome starting with version 123, is a purpose-built successor to the older Long Tasks API, designed to attribute slow, unresponsive frames to the scripts actually causing them. Rather than just telling you a frame took too long, LoAF reports which script, from which domain, was running during that frame, and distinguishes forced synchronous layout work from ordinary script execution.
Google’s own web-vitals JavaScript library has supported this directly since version 4, including LoAF entries in the attribution data attached to every INP measurement. In practice, that means you can pull real user monitoring data and see, for a specific slow interaction, exactly which script – your own code, an analytics tag, a chat widget, an ad script – was blocking the main thread at that moment. Documented case studies from the LoAF origin trial found that a single third-party script was responsible for a site’s sluggish responsiveness; once refactored, responsiveness improved measurably. That’s the kind of specific, evidence-based fix advanced INP work should be aiming for, instead of shotgunning generic performance advice across an entire codebase.
How Do I Find Out Which Script Is Actually Causing Poor INP?#
Use the LoAF API – either directly via performance.getEntriesByType(“long-animation-frame”) in the browser console, or through a real user monitoring tool that surfaces LoAF attribution automatically. Look specifically at the script domain breakdown to separate first-party code from third-party scripts, and check the forced style and layout time on each entry, since that specifically flags layout thrashing rather than plain execution time.
Fix #1: Cooperative Scheduling with scheduler.yield()#
Once you know a specific task is too long, the classic fix has been to break it into chunks and yield to the browser between them, often using hacks like setTimeout(fn, 0). The newer, purpose-built approach is scheduler.yield(), part of the Prioritized Task Scheduling API, which hands control back to the main thread in a way the browser can use to process pending user input before your code resumes – with less overhead and more predictable behavior than the older workarounds. It’s a meaningful upgrade for long-running loops, large data processing, or complex state updates that would otherwise monopolize the thread during a user interaction. Browser support isn’t yet universal, so pair it with a fallback for browsers that don’t yet implement it.
Fix #2: Architectural Patterns That Prevent the Problem Entirely#
Sometimes the most effective INP fix isn’t a smarter scheduling trick – it’s shipping less JavaScript to begin with. Island architecture, popularized by frameworks like Astro, renders most of a page as static HTML and selectively hydrates only the genuinely interactive components, rather than hydrating an entire page’s worth of framework code before anything becomes responsive. This reduces both bundle size and main-thread work competing with user interactions, improving INP and LCP together rather than trading one for the other. Frameworks built around resumability, like Qwik, take a related approach – serializing application state so the browser can resume interactivity without replaying a full hydration pass. Neither approach is a drop-in fix for an existing large application, but both are worth evaluating for new builds or significant rewrites where INP has proven structurally difficult to fix through incremental patching alone.
Fix #3: Isolating and Governing Third-Party Scripts#
Third-party scripts – ad tags, chat widgets, analytics, tag managers – are disproportionately common LoAF culprits precisely because they’re outside your own code review process and can change behavior without your team’s knowledge. Advanced governance means more than “load scripts async”: use a tool like Partytown to move eligible third-party scripts into a web worker, off the main thread entirely; replace heavy embeds (video players, social widgets) with lightweight static facades that only load the full script on genuine user interaction; and treat third-party script budgets as ongoing monitoring, not a one-time audit, since vendors update their own scripts independent of your release cycle.
Fix #4: Eliminating Forced Synchronous Layout and Layout Thrashing#
LoAF’s forced style and layout attribution specifically flags a common but easy-to-miss cause of presentation delay: code that reads a layout-dependent property (like offsetHeight) immediately after writing to the DOM, forcing the browser to recalculate layout synchronously instead of on its normal schedule. The fix is procedural rather than a single line of code – batch all your DOM reads before any writes within an interaction handler, and use requestAnimationFrame for work that genuinely needs to happen in sync with the browser’s rendering cycle rather than immediately.
Measuring What Actually Matters: Field Data Over Lab Scores#
Google evaluates Core Web Vitals using field data from the Chrome User Experience Report at the 75th percentile, meaning your worst quarter of real user sessions determines your score, not your average visitor on a fast connection. Lab tools like Lighthouse can’t measure INP directly at all, since there’s no real user interacting during an automated test – they report Total Blocking Time as a rough proxy instead. That gap is why real user monitoring, ideally with LoAF attribution enabled, matters more for advanced INP work than any lab score.
Marissa Mayer, then a Google vice president, made a related point in 2006 after Google’s own experiments tied page speed directly to search usage: “Users really respond to speed.” Two decades later, that instinct is a measurable, codified standard rather than a hunch – but the underlying lesson hasn’t changed. A page that looks perfect in Lighthouse can still have a genuinely poor INP in the field if real users on real devices trigger interactions your lab test never simulated.
This kind of diagnostic-first performance work is core to the technical SEO audits we run at Search Savvy – pairing field data with LoAF-level attribution rather than applying generic fixes and hoping the score moves. If your team is building out this practice internally, our Technical SEO services page covers how we typically structure that work, our Technical SEO blog category has more on the crawling and rendering side of the same performance picture, and our SEO glossary is a handy reference if some of this terminology is new to parts of your team.
FAQ: Advanced INP Optimization#
What is a good INP score in 2026? Under 200 milliseconds at the 75th percentile of real user sessions is considered good; scores between 200 and 500 milliseconds need improvement, and anything above 500 milliseconds is considered poor.
What’s the difference between the Long Tasks API and the Long Animation Frames API? The Long Tasks API simply flags that a task ran for more than 50 milliseconds. The Long Animation Frames (LoAF) API goes further, attributing the delay to specific scripts and domains and distinguishing forced layout work from plain script execution, making it far more useful for diagnosing INP specifically.
Can Lighthouse measure my site’s actual INP score? No, not directly. Lighthouse runs in a lab environment without real user interactions, so it reports Total Blocking Time as an approximation. Your actual INP score comes from field data collected through the Chrome User Experience Report.
Is scheduler.yield() better than setTimeout for breaking up long tasks? Generally yes, where it’s supported. It’s purpose-built for yielding to the main thread during user interactions with lower overhead and more predictable scheduling than older setTimeout-based workarounds, though a fallback is still needed for browsers that haven’t implemented it.
Do third-party scripts really have that much impact on INP? Yes. Because they run outside your own code review and can change independently of your release cycle, third-party scripts are a frequent and often underestimated source of the long tasks that damage INP, which is why isolating them – via web workers or lightweight facades – is a common advanced fix.
Does improving INP actually affect business outcomes, not just rankings? Case studies referenced in the development of the LoAF API and broader Core Web Vitals research have documented measurable responsiveness improvements translating into better user engagement after fixing specific script-level bottlenecks, reinforcing that INP reflects a real, felt user experience rather than an abstract technical score.
The Bottom Line#
Advanced INP optimization stops being about applying more of the same generic fixes and starts being about precise diagnosis – knowing which of the three interaction phases is actually slow, and which specific script or rendering pattern is responsible. Lean on the Long Animation Frames API to get that attribution, reach for scheduler.yield() and architectural patterns like island architecture where a structural rewrite makes sense, and keep your third-party scripts under active governance rather than a one-time audit. Larry Page could feel 600 milliseconds without a dashboard telling him; the sites that get INP genuinely fast are the ones that built the diagnostic discipline to catch what he’d notice, at a scale no single person could review by feel alone.