
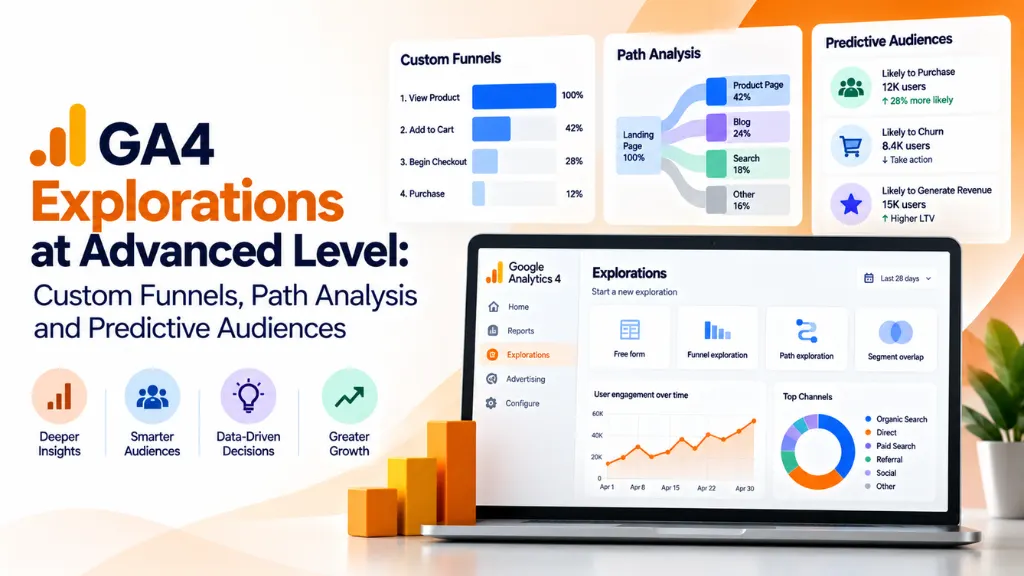

Most GA4 users never leave the standard reports, which means most GA4 users never see where their funnel actually breaks, which pages quietly send visitors backward through a journey, or which users are statistically likely to buy or churn in the next seven days. GA4 Explorations at an advanced level is where that changes – it’s the difference between reading a dashboard someone else designed and building the exact analysis your business question requires.
This guide covers the three techniques inside GA4’s Explore section that do the heaviest analytical lifting: funnel exploration for diagnosing drop-off, path exploration for mapping real (not assumed) user journeys, and predictive audiences for acting on machine-learning forecasts instead of past behavior alone. Along the way, you’ll see the specific settings that separate a rough first attempt from a report you can actually trust.
What Are GA4 Explorations, and Why Go Beyond the Basics?
GA4 Explorations are ad-hoc analysis reports built from raw event data, distinct from GA4’s standard reports, which pull from pre-aggregated tables. Standard reports answer “what happened” with fixed dimensions and metrics; Explorations let you define the question yourself – which sequence of events counts as your funnel, which node type describes a step in a user’s path, or which predictive score should define an audience.
Basic Exploration usage rarely goes past a free-form table with two dimensions. Advanced usage means configuring funnel logic correctly, reading path data without misinterpreting reverse paths, and knowing exactly when predictive audiences are even statistically available to you – three areas where most GA4 users get inconsistent results without realizing why.
Custom Funnel Exploration: Open vs. Closed, and Why It Changes Your Numbers
A funnel exploration visualizes the steps users take toward a goal and shows where they drop off; the single biggest factor in getting accurate numbers is choosing open or closed funnel logic correctly for the question being asked.
In a closed funnel, GA4 only counts users who entered at step one – anyone who lands directly on step two or three, skipping the earlier steps, is excluded entirely from the funnel. In an open funnel, users can enter at any step, and GA4 counts them from wherever they first qualify.
This distinction matters more than most default reports let on. If you’re measuring a strict, sequential checkout flow where step order is mandatory – cart, shipping details, payment – a closed funnel gives you the true completion rate for people who followed the process as designed. But if you’re analyzing something like a content-to-signup journey, where paid traffic, email links, or bookmarks routinely drop users into the middle of the sequence, a closed funnel will understate total volume at every step after the first, because it silently excludes anyone who didn’t start at the top.
A practical way to build a reliable custom funnel:
- Start with an open funnel first to see full volume at each step, regardless of entry point.
- Switch to a closed funnel for the same steps to isolate users who followed the intended sequence exactly.
- Compare the two. A large gap between open and closed completion rates usually means users are entering mid-funnel from a channel or page you haven’t accounted for.
- Set step order to “indirectly followed by” unless the process genuinely requires back-to-back actions with nothing in between – most real user journeys aren’t that rigid, and “directly followed by” will undercount valid completions.
- Apply a breakdown dimension (device category, traffic source, landing page) to see whether drop-off concentrates in one segment rather than being uniform across all users.
One frequently misread detail: when you apply a breakdown dimension to a funnel, GA4 attributes a user to only the first value of that dimension they exhibit, even if it changes mid-funnel. A user who starts on mobile and finishes on desktop is counted as “mobile” for every step of that funnel, which can flatten real device-switching behavior if you’re not aware of it.
Path Exploration: Reading Real User Journeys Without Misreading Them
Path exploration maps the actual sequence of events or pages a user follows, rather than the sequence you assume they follow, and can run forward from a starting point or backward from an ending point to reveal what led users there.
The core concept to understand before building anything is node type. Each step in a path exploration graph can display a different kind of dimension value – event name, page title, page path, or a custom dimension – and you can switch node types at each step independently, rather than being locked to one dimension for the whole graph.
Two path directions serve very different purposes:
- Forward path (starting point): begin from a page, event, or entry point and see where users go next. Use this to answer “after landing on our pricing page, where do users go?”
- Reverse path (ending point): begin from a conversion or exit point and work backward. Use this to answer “what did users do right before they abandoned checkout?” – often far more actionable than a forward view, because it isolates the specific steps immediately preceding the outcome you care about.
A common mistake is treating a single path branch as representative of overall behavior. Path exploration graphs show the most common branches first, but a branch with a small user count can still be statistically noisy. Cross-check any surprising path finding against a funnel exploration or a segment comparison before acting on it – path data is best used to generate hypotheses, and funnels or free-form tables are better for confirming them with clean drop-off rates.
Predictive Audiences: Turning Machine Learning Into Actionable Segments
Predictive audiences use GA4’s built-in machine learning models to group users by the probability they’ll take a future action – purchase, churn, or generate revenue – rather than by actions they’ve already taken.
GA4 currently calculates three predictive metrics natively, once a property qualifies:
| Predictive Metric | What It Predicts |
| Purchase probability | Likelihood a user active in the last 28 days will purchase in the next 7 days |
| Churn probability | Likelihood a user active in the last 7 days will not return in the next 7 days |
| Predicted revenue | Expected revenue from a user active in the last 28 days, over the next 28 days |
None of this is available by default. GA4 requires a property to have logged at least 1,000 returning users who triggered the relevant positive condition (a purchase, for instance) and at least 1,000 returning users who did not, within a rolling 28-day window, before it will calculate the corresponding predictive metric. If a property meets the threshold and later drops below it, the metric becomes unavailable again until the volume recovers – which is worth knowing before you build a campaign around an audience that could silently stop populating.
This threshold rules out predictive audiences for a large share of small and mid-sized sites. A typical ecommerce store converting at 2–3% would need tens of thousands of returning sessions inside a 28-day window just to clear the purchaser side of the requirement, which is one reason predictive audiences tend to show up in case studies from larger, high-traffic properties rather than smaller catalogs.
Where a property does qualify, predictive metrics can be used two ways:
- Inside Explorations, using the User Lifetime technique, to analyze purchase or churn probability by audience, channel, or lifecycle stage without leaving GA4.
- Inside Audience Builder, to create segments like “likely 7-day purchasers” or “likely 7-day churning users,” which can then sync directly to Google Ads for proactive targeting rather than retargeting based on past behavior alone.
Combining a predictive metric with a behavioral condition tends to produce the most useful audiences in practice – for example, a segment of high-lifetime-value purchasers who also carry a high churn probability gives a retention team a shortlist worth prioritizing, rather than a broad, low-signal list of “everyone who bought once.”
Bringing the Three Techniques Together
These techniques answer different parts of the same underlying question – why users convert, stall, or leave – and they’re most useful layered rather than used in isolation:
- Use path exploration in reverse from your conversion event to identify the pages or events immediately preceding success or abandonment.
- Build a funnel exploration around the steps that path analysis surfaced, testing both open and closed logic to see how much volume enters mid-funnel.
- Once you understand where users drop off, check whether predictive audiences are available on your property, and if so, build a segment of users who match your funnel’s biggest drop-off point and carry a high churn or purchase probability – a far more targeted remarketing list than a generic “visited but didn’t convert” segment.
Common Mistakes When Building Advanced Explorations
- Leaving the default date range unchanged. Explorations often default to the last 28 days, which can blend behavior from before and after a site change you’re trying to isolate.
- Assuming closed funnels are always more accurate. They’re more accurate for strictly sequential processes and misleading for anything users can enter mid-way.
- Treating one path branch as the whole story. Small-sample branches in path exploration can look significant visually while representing a tiny fraction of total users.
- Building predictive audiences on properties that don’t meet the data threshold. GA4 will silently fail to populate the audience rather than clearly explaining that the 1,000-user minimum wasn’t met.
- Ignoring sampling on large date ranges. Explorations can apply sampling when the date range or user count is large, which is worth flagging before drawing firm conclusions from a report spanning a full year.
Frequently Asked Questions
What’s the difference between a GA4 report and a GA4 exploration? Standard reports use pre-aggregated data with fixed dimensions and metrics. Explorations query raw event data directly, letting you define custom funnels, paths, segments, and audiences that don’t exist as a built-in report.
Do I need a minimum amount of traffic to use funnel or path exploration? No minimum traffic threshold applies to funnel or path exploration themselves, though very small sample sizes make any individual branch or step statistically unreliable. Predictive audiences are the one feature with a hard data threshold – at least 1,000 users on each side of the predictive condition within a 28-day window.
Why do my open and closed funnel numbers look so different? A large gap usually means a meaningful share of users are entering your funnel mid-sequence – from a paid ad landing on step two, an email linking to step three, or a bookmarked page. The open funnel counts them; the closed funnel doesn’t.
Can predictive audiences be used outside of Google Ads? Yes. Predictive metrics like purchase probability and churn probability can also be analyzed inside Explorations using the User Lifetime technique, independent of whether you export the resulting audience to an ad platform.
How often does GA4 recalculate predictive metrics? GA4 continuously evaluates whether a property still meets the minimum data thresholds; if traffic or conversion volume drops below the requirement, the predictive metric stops being available until the property qualifies again.
Is path exploration better than funnel exploration for finding drop-off? They answer different questions. Funnel exploration gives you a clean drop-off rate at each defined step. Path exploration shows the actual, sometimes unexpected, routes users take, which is better for discovering steps you didn’t know to measure in the first place.
The Bottom Line
Advanced GA4 Explorations work best as a diagnostic sequence, not three unrelated reports: path exploration finds where to look, funnel exploration quantifies what’s happening there, and predictive audiences – where the data threshold is met – turn that understanding into a list you can act on before behavior happens rather than after. None of the three requires additional tooling beyond GA4 itself; they require knowing which setting changes the meaning of the numbers. Search Savvy’s analytics and reporting glossary is a useful reference if you run into GA4 terminology mid-analysis, and for teams building this into a larger measurement strategy, Search Savvy’s content strategy and topical authority services team often works from exactly this kind of behavioral data when deciding which content and journeys to prioritize next.