Building Custom SEO Dashboards with Python, BigQuery and Looker Studio
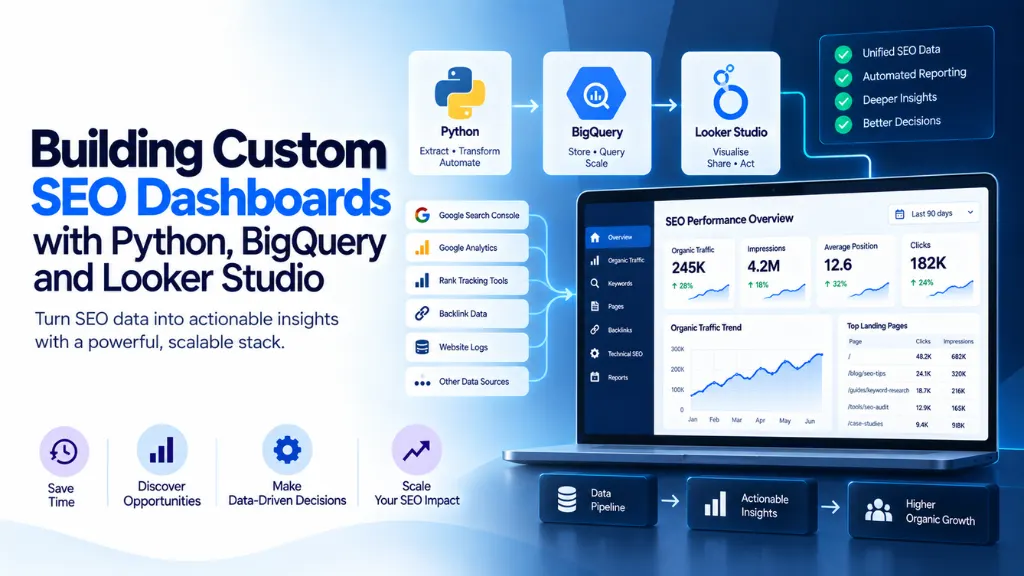

If you manage SEO for a site with more than a few thousand pages, you already know the problem: Google Search Console shows you only 1,000 rows per report and throws away anything older than 16 months, Google Analytics 4 samples your event data the moment volume climbs, and neither tool talks to the other natively. A custom SEO dashboard solves this by pulling raw data from Search Console, GA4, and Core Web Vitals sources into one warehouse and letting you query, join, and visualize it on your own terms.
In this article13 sections
This article walks through exactly how to build one using Python for data collection, BigQuery as the central warehouse, and Looker Studio for reporting – the same stack most in-house SEO and data teams are converging on in 2026. You’ll learn which data sources matter, how the pipeline fits together, what it costs to run, and the mistakes that sink most first attempts.
What Is a Custom SEO Dashboard?#
A custom SEO dashboard is a reporting system built from raw, unaggregated SEO data – typically Search Console performance data, GA4 events, crawl data, and Core Web Vitals metrics – stored in a data warehouse and visualized through a business intelligence tool, rather than viewed through each platform’s native, limited interface.
The key difference from a “regular” SEO report is ownership: you control the schema, the retention period, the joins between data sources, and the exact metrics displayed, instead of being boxed in by what a vendor’s UI decided to expose.
Why Off-the-Shelf SEO Reporting Falls Short#
Search Console’s own interface caps most reports at 1,000 rows and discards performance data older than 16 months, which makes year-over-year analysis on large sites almost impossible without exporting first. The Search Console API is somewhat better but still returns a maximum of 25,000 rows per request, meaning large sites have to paginate through many calls just to get a single day of query-level data.
GA4 has a parallel problem. Its standard reports apply sampling and thresholding once event volume rises, and the interface doesn’t let you blend organic search behavior with server logs, rank tracking, or Core Web Vitals in the same view.
The practical result: teams either live with incomplete data or resort to manually exporting CSVs from three or four separate tools every week – a process that doesn’t scale and introduces errors every time someone renames a column.
The Three-Layer Architecture: Python, BigQuery, and Looker Studio#
A durable custom SEO dashboard has three distinct layers, and keeping them separate is what makes the system maintainable.
Layer 1: Data Collection#
Python is the connective tissue. Libraries like google-api-python-client (for the Search Console Search Analytics API) and google-analytics-data (for the GA4 Data API) let you script scheduled pulls instead of manually exporting reports. For most sites, though, Google’s bulk data export feature is the better starting point: once configured in Search Console’s settings, it writes a full daily snapshot of your performance data – including anonymized queries that the API and UI both hide – directly into a BigQuery dataset, without the 25,000-row API ceiling.
Python still earns its place here for anything the native exports don’t cover: crawl data from your own crawler, rank-tracking exports, server log files, or CrUX API pulls for pages that don’t have enough traffic to appear in the public BigQuery dataset.
Layer 2: Centralizing the Data in BigQuery#
BigQuery is the warehouse where everything meets. Three feeds typically land here:
- Search Console bulk export – a daily dump of your property’s full performance data, set up once in Search Console under Settings → Bulk data export.
- GA4 BigQuery Export – a native, free linkage that writes one events_YYYYMMDD table per day containing unsampled, event-level data, with an events_intraday_ table that updates throughout the current day.
- Chrome UX Report (CrUX) on BigQuery – a public dataset containing origin-level Core Web Vitals data (LCP, INP, CLS) for millions of sites, updated monthly, which you can query directly with your own project’s free tier.
Once these tables exist side by side in the same project, a single SQL query can join search queries, landing-page engagement, and field performance data that would otherwise live in three unrelated tools.
Layer 3: Visualization in Looker Studio#
Looker Studio connects natively to BigQuery, so once your SQL views are built, dashboards update automatically as new data lands. This is also where most teams should stop trying to write raw SQL inside the reporting layer itself – build clean, pre-aggregated views in BigQuery, then point Looker Studio at those views rather than at raw event tables, which keeps dashboards fast and query costs predictable.
Step-by-Step: Building Your First Custom SEO Dashboard#
- Define the question before the dashboard. Write the exact question you’re trying to answer – for example, “which template types lost impressions after the last core update?” – because this decides which tables, date ranges, and joins you actually need.
- Set up your Google Cloud project. Create a project, enable the BigQuery API and BigQuery Storage API, and confirm billing is attached (the free tier still requires a billing account, even if you never get charged).
- Enable the Search Console bulk export. Grant the search-console-data-export@system.gserviceaccount.com service account the BigQuery Job User and BigQuery Data Editor roles, then complete the export setup inside Search Console’s settings using your project ID.
- Link GA4 to BigQuery. In GA4’s Admin panel, connect BigQuery Linking to the same project so events_ tables begin populating daily.
- Query the public CrUX dataset for your domain’s Core Web Vitals history, joining it against your own tables by page path where sample sizes allow.
- Build summary views in BigQuery, not raw table connections, so Looker Studio queries stay fast and cheap.
- Connect Looker Studio to those views and design report pages around the original question from step one, not around “everything the data supports.”
- Schedule Python jobs for anything not natively exported – log files, rank tracker CSVs, internal crawl data – landing them in BigQuery on the same cadence as the native feeds.
What Data Sources Should Feed Your Dashboard?#
| Data Source | What It Provides | Refresh Rate | Access Method |
| Search Console bulk export | Full query, page, and country-level performance, including anonymized queries | Daily | BigQuery bulk export (Settings) |
| Search Console API | Same performance data, capped at 25,000 rows per request | On demand | Python script via Search Analytics API |
| GA4 BigQuery Export | Unsampled, event-level user behavior | Daily (plus intraday) | Native BigQuery Linking in GA4 Admin |
| CrUX on BigQuery | Real-user Core Web Vitals (LCP, INP, CLS) by origin/URL | Monthly | Public BigQuery dataset |
| Server logs / crawl data | Bot behavior, crawl frequency, response codes | Custom | Python ingestion scripts |
How Much Does a Custom SEO Dashboard Cost to Run?#
For most single-site setups, the honest answer is close to nothing. BigQuery’s free tier includes 10 GB of active storage and 1 TB of query processing per month at no cost, and Search Console’s bulk export itself carries no additional fee from Google beyond whatever BigQuery usage it generates. Once usage exceeds the free tier, on-demand queries are billed at roughly $6.25 per terabyte scanned, with active storage priced at about $0.023 per GiB per month.
In practice, a mid-sized site querying well-designed, pre-aggregated views rather than scanning raw event tables every time can stay inside the free tier indefinitely. Costs climb when dashboards query raw events_* tables directly across long date ranges – which is exactly why the summary-view step in the build process above matters more than it looks.
As W. Edwards Deming, the statistician whose work shaped modern quality-management thinking, put it: “In God we trust; all others must bring data.” A custom dashboard is the infrastructure that makes bringing data to every SEO decision actually practical, rather than aspirational.
Custom Dashboard vs. Native Reports vs. Paid SEO Platforms#
| Native GSC/GA4 Reports | Paid SEO Platform | Custom Python + BigQuery + Looker Studio Dashboard | |
| Data retention | 16 months (GSC UI) | Varies by vendor | Unlimited – you control it |
| Row limits | 1,000 (UI), 25,000 (API) | Varies by vendor | None once data is in BigQuery |
| Cross-source joins | Not possible | Limited to vendor’s integrations | Full SQL flexibility |
| Ongoing cost | Free | Monthly subscription | Near-zero to modest, usage-based |
| Setup effort | None | Low | Moderate to high, one-time |
Search Savvy typically recommends this approach to clients running large or multi-brand sites where the reporting gap between “what Search Console shows” and “what the business needs to decide” has become the bottleneck, rather than a nice-to-have.
Common Mistakes to Avoid#
- Connecting Looker Studio directly to raw GA4 or GSC tables instead of building summary views first, which drives up query costs and slows dashboards down.
- Ignoring the CrUX dataset’s coarse percentile bins – LCP is bucketed in 100ms increments and CLS in 0.05 increments, so treating a P75 value as an exact number overstates precision.
- Skipping the “one sentence question” step and building a dashboard that tries to show everything, which usually means nobody uses it after the first week.
- Forgetting that bulk export and BigQuery are two different billing relationships – the export itself is free, but the BigQuery storage and compute it generates is not.
- Not documenting the schema changes when Google updates the GA4 or GSC export format, which silently breaks downstream views months later.
Frequently Asked Questions#
Is Python required to build a custom SEO dashboard? Not strictly. Both the Search Console bulk export and GA4’s BigQuery Export can be configured without writing any code. Python becomes necessary when you need to bring in data GSC and GA4 don’t export natively – server logs, rank tracking exports, or scheduled CrUX API calls for low-traffic pages.
How is a custom SEO dashboard different from Looker Studio’s built-in Search Console connector? The built-in connector queries the Search Console API directly and inherits its 50,000-row limits and shorter retention window. A dashboard built on the bulk export instead reads from your own BigQuery tables, which hold the full daily dataset with no row ceiling.
How often should the dashboard refresh? Match the refresh rate to the underlying data: Search Console’s bulk export and GA4’s daily export both update once per day, so there’s little value refreshing more often than that. CrUX data updates monthly, so Core Web Vitals sections only need a monthly refresh cycle.
Does this replace the need for rank tracking or technical SEO audit tools? No. A custom dashboard centralizes and visualizes data you already have access to; it doesn’t independently crawl or track rankings. Many teams feed a technical SEO audit’s crawl output into the same BigQuery project so it sits alongside performance and behavior data in one place.
What’s the biggest risk in building this in-house versus using a paid platform? Maintenance. Google occasionally changes export schemas, and someone needs to own updating the queries and views when that happens. Teams without a dedicated analyst or developer often find a managed platform lower-risk, even at a higher subscription cost.
Can small sites benefit from this setup, or is it only for enterprise SEO? Small and medium sites usually get everything they need from the Search Console UI, the Looker Studio connector, or the Search Analytics API directly, since Google explicitly built the bulk export for sites too large for those tools to comfortably serve. The bulk export approach pays off once a site has tens of thousands of pages or queries.
The Bottom Line#
A custom SEO dashboard isn’t about replacing Search Console or GA4 – it’s about removing the row limits, retention windows, and single-source-per-report constraints those tools were designed around. Python handles the gaps in native exports, BigQuery becomes the single source of truth once Search Console’s bulk export and GA4’s BigQuery Export are both linked, and Looker Studio turns well-structured views into something a whole team can actually use. Start with one clearly defined question, get the two native exports flowing into BigQuery, and expand the pipeline only as new questions demand it. For teams weighing whether to build this in-house or bring in outside help to set up the pipeline correctly the first time, Search Savvy’s technical SEO services team works through exactly this kind of data infrastructure as part of larger technical engagements.