INP Optimization in 2026: A Practical Fix Checklist
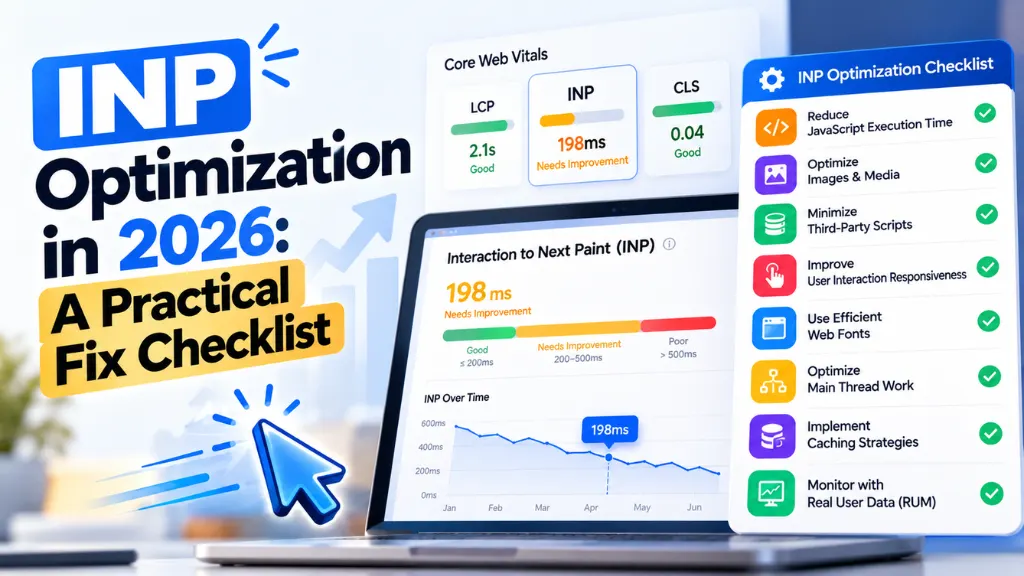

Interaction to Next Paint (INP) has been a Core Web Vital since 12 March 2024, when it replaced First Input Delay. It still trips up a large share of mobile sites. According to the 2025 Web Almanac, 77% of mobile origins had a good INP in July 2025 versus 97% on desktop, while median mobile Total Blocking Time rose 58% year over year to 1,916 ms. Pages are getting heavier even as scores improve.
In this article21 sections
This guide explains what INP measures, how to find the interactions hurting your score, and a checklist of fixes ordered by where the delay sits. The short version: measure real users first, split each slow interaction into input delay, processing time and presentation delay, then fix the phase that dominates.
What Is Interaction to Next Paint (INP)?#
Interaction to Next Paint (INP) is a Core Web Vital that measures how quickly a page responds visually to clicks, taps and key presses throughout a visit. It reports the longest interaction latency observed, sometimes ignoring outliers, and a good score is 200 milliseconds or less at the 75th percentile.
Google’s INP guidance sets three bands, measured across mobile and desktop separately:
| INP at the 75th percentile | Rating |
| 200 ms or less | Good |
| 200 to 500 ms | Needs improvement |
| Over 500 ms | Poor |
Every interaction has three parts, and the sum is its latency:
- Input delay: from the user’s action until event handlers start, often caused by long tasks blocking the main thread.
- Processing duration: the time event handlers take to run.
- Presentation delay: from handlers finishing until the browser paints the next frame.
Knowing which part dominates tells you which fix to try. Unlike FID, INP counts all interactions, not only the first. For pages with many interactions, the reference calculation in the web-vitals library takes the 98th percentile of interactions, which stops one freak event from defining the score.
Does INP Optimization Help SEO and Sales?#
Yes, modestly for SEO and potentially more for conversions. Google says Core Web Vitals are used by its ranking systems, but good scores do not guarantee top rankings.
Google’s page experience documentation recommends achieving good Core Web Vitals while warning that chasing perfect scores purely for SEO may not be the best use of time. The stronger case is business impact: India’s redBus improved INP by 72% and reported about 7% higher sales, according to web.dev. That is one company’s result, not a guarantee, but it shows why responsiveness affects revenue.
How Do You Measure INP?#
Start with field data because INP depends on real interactions and real devices.
- Check CrUX data. PageSpeed Insights and Search Console show Chrome User Experience Report data, which tells you whether INP is a problem and on which device.
- Add real user monitoring (RUM). Web.dev recommends RUM data that names the specific interaction responsible, since CrUX alone lacks context. The web-vitals library’s attribution build does this:
import { onINP } from ‘web-vitals/attribution’;
onINP(({ value, attribution }) => {
navigator.sendBeacon(‘/vitals’, JSON.stringify({
inp: value,
target: attribution.interactionTarget,
inputDelay: attribution.inputDelay,
processing: attribution.processingDuration,
presentation: attribution.presentationDelay,
}));
});
- Use Long Animation Frames. Shipped in Chrome 123, the Long Animation Frames API shows what blocked slow frames, and the library’s attribution includes it.
- Reproduce in the lab. Use Chrome DevTools’ Performance panel, follow real user flows, and interact during page load when the main thread is busiest. Lab Total Blocking Time is a rough proxy but not INP itself.
INP Optimization Checklist: Fix Each Phase#
Reduce Input Delay#
Input delay usually comes from long tasks, meaning work that occupies the main thread for over 50 milliseconds.
- Cut startup JavaScript. Parsing, compiling and executing scripts creates long tasks while users may already be tapping.
- Audit third-party tags. Chat widgets, tag managers and ad scripts often run on the main thread. Load only what a page needs, and later where possible.
- Watch iframes. Each frame has its own main thread, but INP reports slow interactions inside iframes at page level.
Search Savvy’s website design and development glossary is useful for non-developers who need plain-English definitions of these terms.
Shorten JavaScript Execution Time#
Processing duration is the time your handlers take, so JavaScript execution time is the target.
- Do less in the handler. Update what the user must see first and defer everything else.
- Yield to the main thread. Break work into separate tasks so rendering can run. scheduler.yield() is supported in Chrome and Edge 129 and Firefox 142, but not Safari, so use a fallback:
function yieldToMain() {
if (globalThis.scheduler?.yield) return scheduler.yield();
return new Promise((resolve) => setTimeout(resolve, 0));
}
async function onAddToCart() {
updateCartUI(); // render-critical work first
await yieldToMain(); // let the browser paint
sendAnalytics(); // everything else afterwards
}
- Remember the await. Web.dev warns that scheduler.yield() only schedules a task; the await does the pausing, and forEach will not wait.
- Avoid layout thrashing. Writing styles then reading layout values in the same task forces synchronous layout.
- Move heavy computation to Web Workers where it does not need the DOM.
Cut Presentation Delay#
Presentation delay is rendering work after your code finishes.
- Reduce DOM size. Web.dev notes large DOMs make rendering updates more expensive, both at load and after interactions.
- Use content-visibility to skip rendering off-screen content.
- Be careful rendering HTML in JavaScript. Large client-rendered updates delay the next frame.
Quick Diagnosis Table#
| Slowest subpart | Common cause | First fix |
| Input delay | Long tasks, startup scripts, third-party tags | Split bundles, defer tags |
| Processing | Heavy handlers, layout thrashing | Yield, defer non-visual work |
| Presentation | Large DOM, expensive style and layout | Trim DOM, content-visibility |
A Worked Example: A Slow Product Filter#
The following scenario is illustrative, not a benchmark. Imagine a category page where tapping a filter re-renders 400 product cards. Field data shows a poor INP, and attribution points to the filter button with a long processing duration.
- Update the filter chip’s selected state immediately, since that is what the shopper needs to see first.
- Yield to the main thread so the browser can paint that feedback.
- Re-render the product grid afterwards, in smaller batches if needed.
- Apply content-visibility to cards below the fold so rendering skips them.
- Move analytics calls out of the click handler.
Each step targets a different subpart: feedback paints sooner, the handler stops blocking, and the render workload shrinks.
Triage Third-Party Scripts#
Third-party code is a frequent source of input delay because it competes for the same main thread. Work through it methodically:
- Inventory every tag, widget and script, and record who owns each.
- Use Long Animation Frame attribution to see which scripts ran during slow interactions.
- Remove anything unused, and defer what is not needed at load.
- Load heavy widgets, such as chat, only when a user asks for them.
A Repeatable INP Fix Workflow#
- Pull CrUX INP by device and by page group.
- Add attribution logging and collect a week of data.
- List the three worst interactions by frequency and latency.
- Reproduce each in DevTools, throttling CPU to approximate mid-range phones.
- Fix the dominant subpart, then re-measure.
- Wait for field data to catch up and repeat.
As web.dev says, “The key to improving INP is persistence.” Fixing one interaction often reveals another.
What Changed for INP in 2026?#
The Web Almanac found INP reporting expanded beyond Chrome, improving cross-browser measurement. It also found secondary pages performed worse than home pages on mobile (69% versus 80% good INP), likely because they carry filters, carousels, form validation and third-party widgets. So check product listings and checkout pages, not just your homepage. Search Savvy’s Google algorithm update tracker helps you follow related Google changes.
Common Mistakes to Avoid#
- Trusting Lighthouse alone. It is lab data; INP needs field data.
- Optimizing only the homepage. Interactive templates often fail.
- Yielding indiscriminately. Yielding has overhead, so avoid it between tiny jobs.
- Forgetting the await. The yield never happens.
- Ignoring third parties. Their scripts affect your INP.
- Expecting instant results. Field reports aggregate real user data over time.
Frequently Asked Questions#
What Is a Good INP Score?#
200 milliseconds or less at the 75th percentile of page loads, measured separately for mobile and desktop. Between 200 and 500 ms needs improvement, and above 500 ms is poor.
What Replaced First Input Delay?#
INP replaced FID as a Core Web Vital on 12 March 2024. FID measured only the first interaction’s delay, while INP covers all interactions and their full latency.
Can Lighthouse Measure INP?#
Not directly. INP is a field metric based on real interactions. Use PageSpeed Insights or Search Console for CrUX data, and DevTools for lab diagnosis.
How Long Until Improvements Show in Search Console?#
Field reports aggregate real user data over a rolling window, so expect weeks, not days. Ship fixes, keep monitoring RUM, and avoid judging results too early.
Does scheduler.yield() Work in Every Browser?#
No. It works in Chrome and Edge 129 and Firefox 142, but not Safari. Use feature detection with a setTimeout fallback or a polyfill.
What Is a Long Task?#
Any main-thread task lasting over 50 milliseconds. It blocks input and painting, so interactions during it suffer input delay.
The Bottom Line#
INP optimization comes down to finding the slow interaction in real user data, identifying which of the three phases dominates, and fixing that phase before repeating. This week, pull CrUX INP for your top templates, add attribution logging, and tackle the single worst interaction. If you want an outside review, Search Savvy’s website audit services and technical SEO services are a practical starting point, and stores can also look at e-commerce SEO services. For rebuilds, see website design and development.